Americans' face mask usage varies greatly by demographics
Gallup has been measuring U.S. adults' use of face masks since early April and has found nearly nine in 10 say they have used one in the past week. Yet, new data on how often masks are being used reveals that less than half of Americans are heeding health officials' guidance and always covering their nose and mouth when in public, especially when social distancing is difficult to maintain.
Forty-four percent of U.S. adults say they "always" wear a mask when outside their homes, and 28 percent say they do so "very often." At the same time, three in 10 report doing so less often, including 11 percent "sometimes," 4 percent "rarely" and 14 percent "never."
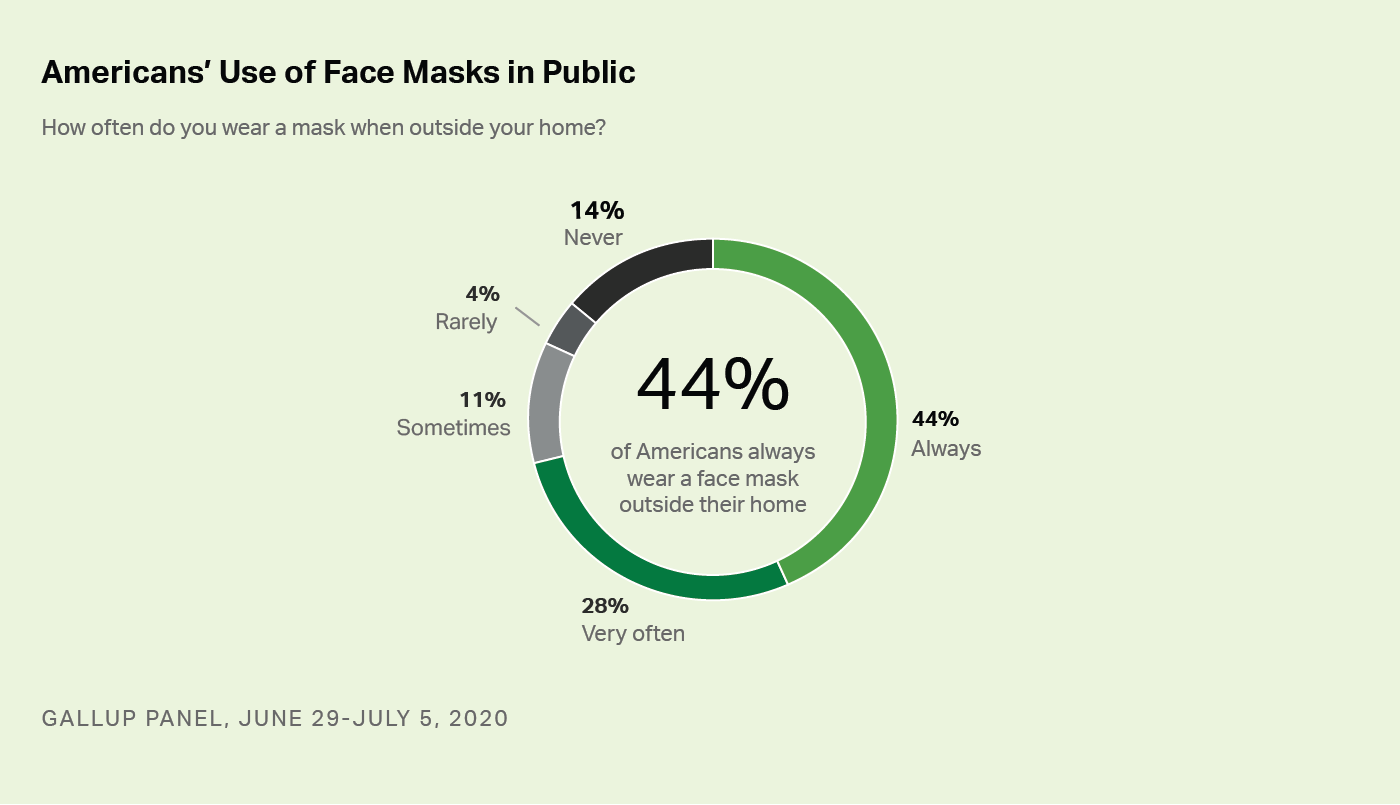
These latest findings are from the probability-based online Gallup Panel survey conducted June 29-July 5, as COVID-19 cases were surging in several states, including Florida, Texas, Arizona and California. With cases nationwide continuing to spike, many public health officials and politicians are imploring Americans to wear masks. Notably, a number of states recently began to mandate the use of masks when in public. Yet, it may fall on deaf ears for some Americans who are resistant to using them, says Gallup.
While majorities of women (54 percent), Democrats (61 percent), Northeasterners (54 percent), and those with annual household incomes under $36,000 (51 percent) say they always use masks outside their homes, their counterparts do so less often. Still, with just one exception, majorities in each of these subgroups -- as well as education and age groups -- say they wear a mask in public at least very often, notes Gallup.
The one exception is Republicans, among whom a majority say they wear masks infrequently -- either sometimes (18 percent), rarely (9 percent) or never (27 percent).
| Always | Very often | Sometimes | Rarely | Never | ||||||||||||||||||||||||||||||||||||||||||||||||||||||||||||||||||||||||||||||||||||||||||||||||
|---|---|---|---|---|---|---|---|---|---|---|---|---|---|---|---|---|---|---|---|---|---|---|---|---|---|---|---|---|---|---|---|---|---|---|---|---|---|---|---|---|---|---|---|---|---|---|---|---|---|---|---|---|---|---|---|---|---|---|---|---|---|---|---|---|---|---|---|---|---|---|---|---|---|---|---|---|---|---|---|---|---|---|---|---|---|---|---|---|---|---|---|---|---|---|---|---|---|---|---|---|
| % | % | % | % | % | ||||||||||||||||||||||||||||||||||||||||||||||||||||||||||||||||||||||||||||||||||||||||||||||||
| U.S. adults | 44 | 28 | 11 | 4 | 14 | |||||||||||||||||||||||||||||||||||||||||||||||||||||||||||||||||||||||||||||||||||||||||||||||
| Gender | ||||||||||||||||||||||||||||||||||||||||||||||||||||||||||||||||||||||||||||||||||||||||||||||||||||
| Male | 34 | 29 | 13 | 4 | 20 | |||||||||||||||||||||||||||||||||||||||||||||||||||||||||||||||||||||||||||||||||||||||||||||||
| Female | 54 | 27 | 8 | 3 | 8 | |||||||||||||||||||||||||||||||||||||||||||||||||||||||||||||||||||||||||||||||||||||||||||||||
| Party Identification | ||||||||||||||||||||||||||||||||||||||||||||||||||||||||||||||||||||||||||||||||||||||||||||||||||||
| Republican | 24 | 22 | 18 | 9 | 27 | |||||||||||||||||||||||||||||||||||||||||||||||||||||||||||||||||||||||||||||||||||||||||||||||
| Independent | 41 | 27 | 12 | 2 | 18 | |||||||||||||||||||||||||||||||||||||||||||||||||||||||||||||||||||||||||||||||||||||||||||||||
| Democrat | 61 | 33 | 4 | 1 | 1 | |||||||||||||||||||||||||||||||||||||||||||||||||||||||||||||||||||||||||||||||||||||||||||||||
| U.S. Region | ||||||||||||||||||||||||||||||||||||||||||||||||||||||||||||||||||||||||||||||||||||||||||||||||||||
| Northeast | 54 | 23 | 10 | 4 | 8 | |||||||||||||||||||||||||||||||||||||||||||||||||||||||||||||||||||||||||||||||||||||||||||||||
| South | 47 | 26 | 11 | 3 | 13 | |||||||||||||||||||||||||||||||||||||||||||||||||||||||||||||||||||||||||||||||||||||||||||||||
| West | 42 | 33 | 10 | 4 | 10 | |||||||||||||||||||||||||||||||||||||||||||||||||||||||||||||||||||||||||||||||||||||||||||||||
| Midwest | 33 | 29 | 11 | 4 | 23 | |||||||||||||||||||||||||||||||||||||||||||||||||||||||||||||||||||||||||||||||||||||||||||||||
| Annual Household Income | ||||||||||||||||||||||||||||||||||||||||||||||||||||||||||||||||||||||||||||||||||||||||||||||||||||
| Less than $36,000 | 51 | 25 | 9 | 1 | 14 | |||||||||||||||||||||||||||||||||||||||||||||||||||||||||||||||||||||||||||||||||||||||||||||||
| $36,000-less than $90,000 | 43 | 26 | 12 | 4 | 15 | |||||||||||||||||||||||||||||||||||||||||||||||||||||||||||||||||||||||||||||||||||||||||||||||
| $90,000 or more | 44 | 30 | 10 | 3 | 13 | |||||||||||||||||||||||||||||||||||||||||||||||||||||||||||||||||||||||||||||||||||||||||||||||
| Education | ||||||||||||||||||||||||||||||||||||||||||||||||||||||||||||||||||||||||||||||||||||||||||||||||||||
| College graduate | 49 | 36 | 8 | 2 | 4 | |||||||||||||||||||||||||||||||||||||||||||||||||||||||||||||||||||||||||||||||||||||||||||||||
| Not college graduate | 41 | 24 | 12 | 5 | 18 | |||||||||||||||||||||||||||||||||||||||||||||||||||||||||||||||||||||||||||||||||||||||||||||||
| Age | ||||||||||||||||||||||||||||||||||||||||||||||||||||||||||||||||||||||||||||||||||||||||||||||||||||
| 18-34 years old | 42 | 34 | 10 | 5 | 9 | |||||||||||||||||||||||||||||||||||||||||||||||||||||||||||||||||||||||||||||||||||||||||||||||
| 35-54 years old | 42 | 27 | 11 | 3 | 16 | |||||||||||||||||||||||||||||||||||||||||||||||||||||||||||||||||||||||||||||||||||||||||||||||
| 55 and older | 47 | 24 | 11 | 3 | 14 | |||||||||||||||||||||||||||||||||||||||||||||||||||||||||||||||||||||||||||||||||||||||||||||||
| GALLUP PANEL, JUNE 29-JULY 5, 2020 | ||||||||||||||||||||||||||||||||||||||||||||||||||||||||||||||||||||||||||||||||||||||||||||||||||||
Looking for a reprint of this article?
From high-res PDFs to custom plaques, order your copy today!