229,339 Vehicles With Keys in Ignition Stolen from 2016-2018
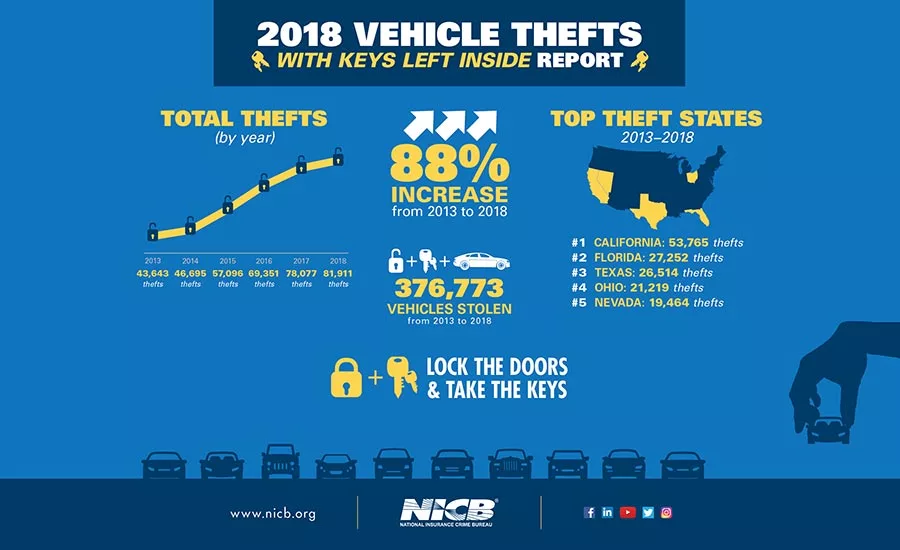
On every single day from January 1, 2016, through December 31, 2018, an average of 209 vehicles were stolen across the U.S. because drivers left their keys or fobs in their vehicles making them attractive targets for thieves. The report from the National Insurance Crime Bureau (NICB) shows that during this three-year period, a total of 229,339 vehicles were stolen in this manner—a 56 percent increase since 2015. When including the numbers from 2013, that increase balloons to 88 percent.
NICB analysts reviewed data contained in the National Crime Information Center’s stolen vehicle file to produce this report. Records were queried using thefts with keys and similar variants as search criteria. The number of thefts with keys or fobs left inside may be substantially higher since many drivers don’t admit to making the mistake and it’s not reported in the police report or insurance claim.
While national vehicle thefts have enjoyed a steep decline since 2003, in recent years, there have been some upticks in thefts; most notably in 2016 when 765,484 vehicles were reported stolen—an increase of 57,726 from 2015. According to the report, in that same year, 69,351 vehicles were stolen as a result of keys or fobs remaining in the vehicle. Had those complacency thefts not occurred, 2016 would have posted a decrease rather than an increase in annual vehicle thefts.
The top ten states with the most thefts with keys during this period were:
- California (31,185)
- Florida (17,300)
- Texas (15,511)
- Ohio (12,596)
- Nevada (11,391)
- Georgia (9,128)
- Illinois (8,308)
- Wisconsin (7,846)
- Indiana (7,721)
- Michigan (7,521)
The top ten Core-Based Statistical Areas (CBSA) with the most thefts with keys were:
- Las Vegas-Henderson-Paradise, NV (11,073)
- Miami-Fort Lauderdale-West Palm Beach, FL (7,549)
- Atlanta-Sandy Springs-Roswell, GA (7,501)
- Chicago-Naperville-Elgin, IL (7,086)
- Dallas-Fort Worth-Arlington, TX (6,603)
- Milwaukee-Wakesha-West Allis, WI (6,341)
- Minneapolis-St.Paul-Bloomington, MN-WI (6,327)
- Louisville-Jefferson County, KY-IN (5,702)
- Indianapolis-Carmel-Anderson, IN (5,519)
- Los Angeles-Long Beach-Anaheim, CA (5,101)
Warming and cooling vehicles seems to have played a part in these thefts since the most occurred in winter and fall. December was first with 22,155. It was followed by January (21,384), November (20,080), October (19,918) and July (19,811).
The top five specific dates with the most reported thefts were in January and December, with January having four of the five. January 1, 2018, was the top spot with 321 thefts. January 3, 2018, was next with 309 thefts, followed by January 5, 2018 (307), December 27, 2017 (299) and January 2, 2018 (296).
Reviewing day-of-week theft occurrence data, Monday was the preferred theft day with 34,948 thefts. Friday was next with 33,582, followed by Saturday (33,214), Sunday (32,100) and Tuesday (32,085).
“We can’t stress enough the importance of locking your vehicle and taking the key or fob with you when you leave it,” said NICB President and CEO Joe Wehrle. “Anti-theft technology works, but only if you use it.”
The full report can be viewed and downloaded here.
Looking for a reprint of this article?
From high-res PDFs to custom plaques, order your copy today!