Can You Measure Your Building’s Penetration Risk? - Part 2
Part 2 of a 2-part series on security entrance metrics


In Part I of this series, we emphasized how enterprises cannot adequately manage their risk of physical penetration without knowing exactly who comes and goes from their facilities. We presented the argument that as ESRM becomes a fundamental discipline in managing enterprise security, we all must stop running from the “elephant in the room” by implementing a real, effective tailgating prevention strategy. Combined with other analytical methods available today, this will allow security professionals to more effectively meet the challenges of our increasingly insecure world. In Part II, we’ll explain how to achieve measurable, predictive data to prove the value of the work you do.
Long List of Metrics Available Today
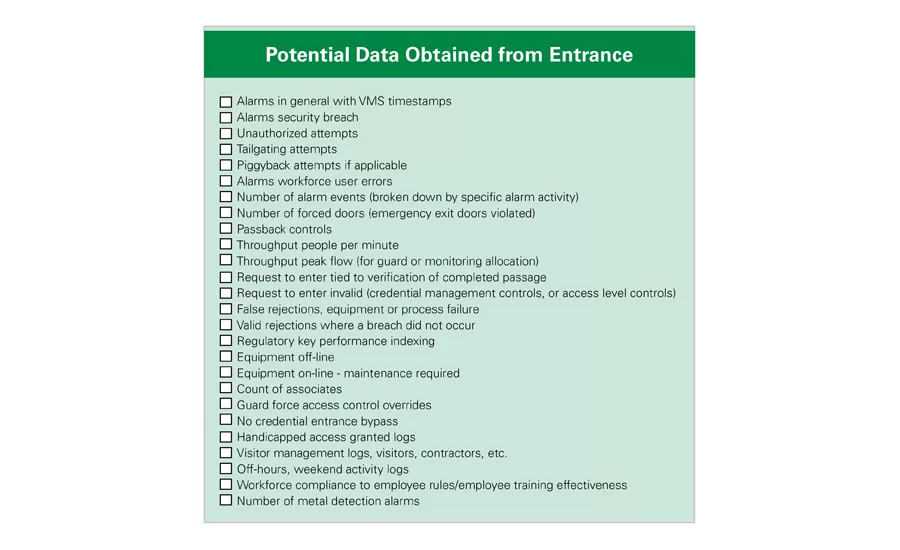
In Part I, we discussed how measuring performance is mostly about analyzing alarm outputs and complaints and reacting, but not predicting outcomes with real data. The list below (and image 1 above) is an incomplete list of the potential data you can obtain at the entrance, from either the access control system or the security entrance itself – optical turnstile, security revolving door or mantrap portal. Some of the data applies to certain types of entrances and not all:
Potential Data Obtained from Entrances
- Alarms in general with VMS timestamps
- Alarms security breach
- Unauthorized attempts
- Piggyback attempts if applicable
- Alarms workforce user errors
- Number of alarm events (broken down by specific alarm activity)
- Number of forced doors (emergency exit doors violated)
- Passback controls
- Throughput people per minute
- Throughput peak flow (for guard or monitoring allocation)
- Request to enter tied to verification of completed passage
- Request to enter invalid (credential management controls, or access level controls)
- False rejections, equipment or process failure
- Valid rejections where a breach did not occur
- Regulatory key performance indexing
- Equipment off-line
- Equipment on-line – maintenance required
- Count of associates
- Guard force access control overrides
- No credential entrance bypass
- Handicapped access granted logs
- Visitor management logs, visitors, contractors, etc
- Off-hours, weekend activity logs
- Workforce compliance to employee rules/employee training effectiveness
- Number of metal detection alarms
You will agree: this is a long list, and that’s a good thing. We’ve made much progress in the past decade. If you capture this data and monitor it, you can ensure your guard force, security protocols and throughput are more efficient. For example, if there are a lot of valid entrance rejections, you can train staff on proper use to get that number down. Rejections result in people backing out of entrances, which reduces throughput during rush periods. So, addressing rejections kills two birds with one stone.
Metrics, Benefits… and the Ultimate Metric
In Table 2 showing some basic examples above, let’s examine how some metrics can improve efficiency.
It’s likely you have been striving to achieve these efficiencies already. But again, none of the metrics presented here can tell you your risk of penetration—only what is happening, so you can work harder at your job. Now, what if we add this element shown in Table 3 above.
The fact is certain types of security entrances do offer this type of metric. How is this possible?
Turnstiles and the Concept of “False Acceptance”
First, let’s review how different security entrances work. With an optical turnstile, you have “below the waistline sensors” to detect if one or two people are walking through. If sensors detect two people, it alarms. But both people still get through. What’s the chance of this happening again in the future? 100 percent. That’s why you must have a guard present.
Here’s another type of breach: two people can get through the turnstile with no alarm at all. This is called “false acceptance.” The chance of false acceptance (a breach) is higher than 0 percent and is currently unknowable. From this point on, you need a guard to notice the infraction and intervene, but there’s still risk here. Thus, optical turnstiles provide security, but security with a number of holes in it and no clear metric for the risk of breach. Taking a page from the IT security handbook, this tailgating detection strategy would not be considered a reliable component within a “threat kill-chain.”
How “Always Closed” Entrances Create Automated SOPs
Different from an optical turnstile, a security revolving door or mantrap portal operates on a simple principle; the entrance is always closed, never available for a breach. This allows the entrance technology to focus on the entire human body with extremely tight parameters and predictable variables for analytics. These variables include lighting, space and time, all of which are important for consistent repeatable outcomes, and they dramatically assist with evidence collection.
As a result, you can administer preset, standardized and automated SOPs that resolve operational and user conflicts without any direct human intervention. Someone presents their credentials, and the door allows them through. If someone tries to tailgate or piggyback, the door stops, and they are rebuffed. Guards do not need to supervise this entrance. So, thanks to this technology, here is a standardized, automated SOP that provides two important things to any security manager: one, an ROI tied to the efficient use of resources and manpower, and two, the SOP allows for predictable measurement that is tied to asset protection, compliance and risk.
The Technology Does the Math
What technology is at play and how is a probability estimate of breach, or false acceptance, generated? The technology employs near infrared light and optics combined with sampling rates and algorithms, which in turn provide scientifically measured and highly reliable probabilities. A user’s passage creates a 3D image, which is analyzed for its shape. If you set the sampling rates to the highest level, which requires close to zero perceived anomalies (user must be a “perfect” shape, not moving, no odd “bumps”, hats or packages), the technology will tell you the probability of false acceptance is near 0 percent. However, this sampling rate will increase the probability of a false rejection (authorized user is rejected). The security professional must balance false rejection vs. false acceptance, according to their own risk level. The impressive achievement with this entrance technology is that risk is scientifically measured and reported; it can be deployed across an enterprise with predictable results, and your security entrance is now a vital part of your physical security threat kill-chain.
Relevant KPIs Make all the Difference
Today, it is entirely possible to deploy entrances with a standardized SOP that provides one metric that until now has been unattainable: the exact probability of a building being penetrated through an entrance. A tailgating prevention strategy that protects an enterprise’s assets, people and brand depends on known Key Performance Indicators (KPIs). Without relevant KPIs, how can physical security be viewed as an effective, fundamental part of the threat kill-chain? With all the challenges a security professional faces, what is possible today? The ability to implement a critical part of a threat kill-chain that bridges physical security with IT, and at the same time contributes ROI dollars to the enterprise. Now, that’s a very notable achievement.
Looking for a reprint of this article?
From high-res PDFs to custom plaques, order your copy today!