Security Magazine logo
search
cart
facebook twitter linkedin youtube
  • Sign In
  • Create Account
  • Sign Out
  • My Account
Security Magazine logo
  • NEWS
    • Security Newswire
    • Technologies & Solutions
  • MANAGEMENT
    • Leadership Management
    • Enterprise Services
    • Security Education & Training
    • Logical Security
    • Security & Business Resilience
    • Profiles in Excellence
  • PHYSICAL
    • Access Management
    • Fire & Life Safety
    • Identity Management
    • Physical Security
    • Video Surveillance
    • Case Studies (Physical)
  • CYBER
    • Cybersecurity News
    • More
  • BLOG
  • COLUMNS
    • Career Intelligence
    • Cyber Tactics
    • Cybersecurity Education & Training
    • Leadership & Management
    • Security Talk
  • EXCLUSIVES
    • Annual Guarding Report
    • Most Influential People in Security
    • The Security Benchmark Report
    • Top Guard and Security Officer Companies
    • Top Cybersecurity Leaders
    • Women in Security
  • SECTORS
    • Arenas / Stadiums / Leagues / Entertainment
    • Banking/Finance/Insurance
    • Construction, Real Estate, Property Management
    • Education: K-12
    • Education: University
    • Government: Federal, State and Local
    • Hospitality & Casinos
    • Hospitals & Medical Centers
    • Infrastructure:Electric,Gas & Water
    • Ports: Sea, Land, & Air
    • Retail/Restaurants/Convenience
    • Transportation/Logistics/Supply Chain/Distribution/ Warehousing
  • EVENTS
    • Industry Events
    • Webinars
    • Solutions by Sector
    • Security 500 Conference
  • MEDIA
    • Interactive Spotlight
    • Photo Galleries
    • Podcasts
    • Polls
    • Videos
      • Cybersecurity & Geopolitical Discussion
      • Ask Me Anything (AMA) Series
  • MORE
    • Call for Entries
    • Classifieds & Job Listings
    • Continuing Education
    • Newsletter
    • Sponsor Insights
    • Store
    • White Papers
  • EMAG
    • eMagazine
    • This Month's Content
    • Advertise
  • SIGN UP!
ManagementPhysicalSecurity NewswireTechnologies & SolutionsSecurity Enterprise ServicesSecurity Leadership and ManagementLogical SecuritySecurity & Business Resilience

FBI releases 2019 hate crime statistics

FBI
November 20, 2020

The FBI released Hate Crime Statistics, 2019, the Uniform Crime Reporting (UCR) Program’s latest compilation about bias-motivated incidents throughout the nation. The 2019 data, submitted by 15,588 law enforcement agencies, provide information about the offenses, victims, offenders, and locations of hate crimes.

Law enforcement agencies submitted incident reports involving 7,314 criminal incidents and 8,559 related offenses as being motivated by bias toward race, ethnicity, ancestry, religion, sexual orientation, disability, gender, and gender identity. Please note the UCR Program does not estimate offenses for the jurisdictions of agencies that do not submit reports. Highlights of Hate Crime Statistics, 2019 follow. (Due to rounding, percentage breakdowns may not add to 100%.)

Victims of Hate Crime Incidents

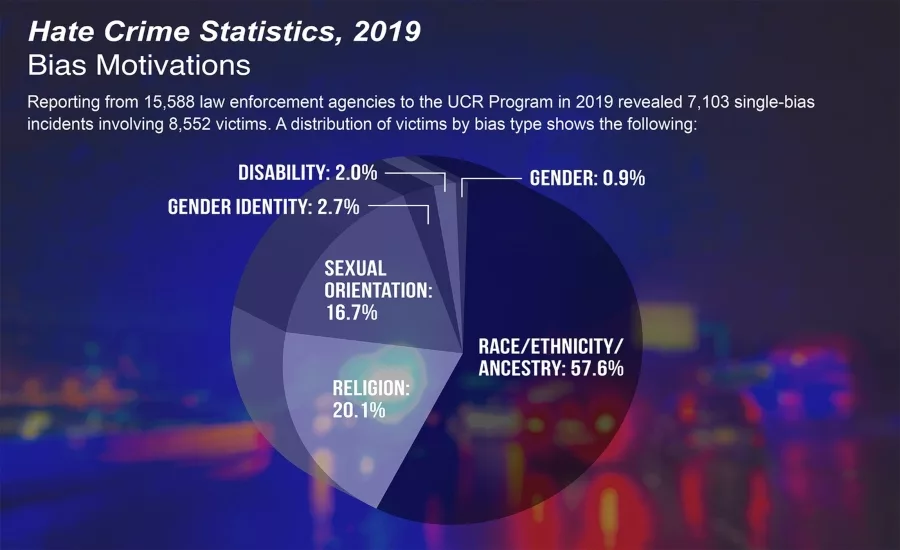
  • There were 7,103 single-bias incidents involving 8,552 victims. A percent distribution of victims by bias type shows that 57.6% of victims were targeted because of the offenders’ race/ethnicity/ancestry bias; 20.1% were targeted because of the offenders’ religious bias; 16.7% were victimized because of the offenders’ sexual-orientation bias; 2.7% were targeted because of the offenders’ gender identity bias; 2.0% were victimized because of the offenders’ disability bias; and 0.9% were victimized because of the offenders’ gender bias.
  • There were 211 multiple-bias hate crime incidents, which involved 260 victims.

Offenses by Crime Category

  • Of the 5,512 hate crime offenses classified as crimes against persons in 2019, 40% were for intimidation, 36.7% were for simple assault, and 21% were for aggravated assault. Fifty-one (51) murders; 30 rapes; and three offenses of human trafficking (commercial sex acts) were reported as hate crimes. The remaining 41 hate crime offenses were reported in the category of other.
  • There were 2,811 hate crime offenses classified as crimes against property. The majority of these (76.6%) were acts of destruction/damage/vandalism. Robbery, burglary, larceny-theft, motor vehicle theft, arson, and other offenses accounted for the remaining 23.4% of crimes against property.
  • Two hundred thirty-six (236) additional offenses were classified as crimes against society. This crime category represents society’s prohibition against engaging in certain types of activity such as gambling, prostitution, and drug violations. These are typically victimless crimes in which property is not the object.

Known Offenders

  • In the UCR Program, the term known offender does not imply that the suspect’s identity is known; rather, the term indicates that some aspect of the suspect was identified, thus distinguishing the suspect from an unknown offender. Law enforcement agencies specify the number of offenders and, when possible, the race of the offender or offenders as a group. Beginning in 2013, law enforcement began reporting whether suspects were juveniles or adults, as well as the suspect’s ethnicity when possible.
    • Of the 6,406 known offenders, 52.5% were white, and 23.9% were Black or African American. Other races accounted for the remaining known offenders: 1.1% were American Indian or Alaska Native, 0.9% were Asian, 0.3% were Native Hawaiian or Other Pacific Islander, and 6.6% were of a group of multiple races. The race was unknown for 14.6%.
    • Of the 5,443 known offenders for whom ethnicity was reported, 33.1% were Not Hispanic or Latino, 10% were Hispanic or Latino, and 1.9% were in a group of multiple ethnicities. Ethnicity was unknown for 55.0% of these offenders.
    • Of the 5,599 known offenders for whom ages were known, 84.6% were 18 years of age or older.

Locations of Hate Crimes

Law enforcement agencies may specify the location of an offense within a hate crime incident as 1 of 46 location designations. In 2019, most hate crime incidents (24.6%) occurred in or near residences/homes. More than 18% (18.2) occurred on highways/roads/alleys/streets/sidewalks; 9.6% occurred at schools/colleges; 4.7% happened at parking/drop lots/garages; and 4.4% took place in churches/synagogues/temples/mosques. The location was reported as other/unknown for 11.2% of hate crime incidents. The remaining 27.3% of hate crime incidents took place at other or multiple locations.

Note: This edition of Hate Crime Statistics and the upcoming edition of NIBRS (which is scheduled for release later this year) are the final UCR crime data publications to be released in the traditional format on fbi.gov. Beginning January 1, 2021, UCR data will be published exclusively to the FBI’s Crime Data Explorer. The traditional publications for 2019 and previous years will remain on fbi.gov for the foreseeable future.

The full Hate Crime Statistics, 2019 report is available at https://ucr.fbi.gov/hate-crime/2019.

KEYWORDS: crimes FBI hate crime violence

Share This Story

Looking for a reprint of this article?
From high-res PDFs to custom plaques, order your copy today!

Recommended Content

JOIN TODAY
To unlock your recommendations.

Already have an account? Sign In

  • Iintegration and use of emerging tools

    Future Proof Your Security Career with AI Skills

    AI’s evolution demands security leaders master...
    Columns
    By: Jerry J. Brennan and Joanne R. Pollock
  • The 2025 Security Benchmark Report

    The 2025 Security Benchmark Report

    The 2025 Security Benchmark Report surveys enterprise...
    The Security Benchmark Report
    By: Rachelle Blair-Frasier
  • The Most Influential People in Security 2025

    Security’s Most Influential People in Security 2025

    Security Magazine’s 2025 Most Influential People in...
    Most Influential People in Security
    By: Security Staff
Manage My Account
  • Security Newsletter
  • eMagazine Subscriptions
  • Manage My Preferences
  • Online Registration
  • Mobile App
  • Subscription Customer Service

More Videos

Sponsored Content

Sponsored Content is a special paid section where industry companies provide high quality, objective, non-commercial content around topics of interest to the Security audience. All Sponsored Content is supplied by the advertising company and any opinions expressed in this article are those of the author and not necessarily reflect the views of Security or its parent company, BNP Media. Interested in participating in our Sponsored Content section? Contact your local rep!

close
  • critical event management
    Sponsored byEverbridge

    Why a Unified View Across IT, Continuity, and Security Makes or Breaks Crisis Response

  • Charlotte Star Room
    Sponsored byAMAROK

    In an Uncertain Economy, Security Is a Necessity - Not an Afterthought

  • Sureview screen
    Sponsored bySureView Systems

    The Evolution of Automation in the Command Center

Popular Stories

Cybersecurity trends of 2025

3 Top Cybersecurity Trends from 2025

Red laptop

Security Leaders Discuss SitusAMC Cyberattack

Green code

Logitech Confirms Data Breach, Security Leaders Respond

Neon human and android hands

65% of the Forbes AI 50 List Leaked Sensitive Information

The Louvre

After the Theft: Why Camera Upgrades Should Begin With a Risk Assessment

Top Cybersecurity Leaders

Events

September 18, 2025

Security Under Fire: Insights on Active Shooter Preparedness and Recovery

ON DEMAND: In today’s complex threat environment, active shooter incidents demand swift, coordinated and well-informed responses.

December 11, 2025

Responding to Evolving Threats in Retail Environments

Retail security professionals are facing an increasingly complex array of security challenges — everything from organized retail crime to evolving cyber-physical threats and public safety concerns.

View All Submit An Event

Products

Security Culture: A How-to Guide for Improving Security Culture and Dealing with People Risk in Your Organisation

Security Culture: A How-to Guide for Improving Security Culture and Dealing with People Risk in Your Organisation

See More Products

Related Articles

  • FBI Releases Hate Crime Statistics

    See More
  • FBI's Annual Hate Crime Statistics Show Slight Decease

    See More
  • Police crime scene tape

    FBI Releases 2018 Hate Crime Stats

    See More

Related Products

See More Products
  • 9781138378339.jpg

    Surveillance, Crime and Social Control

  • 9780815378068.jpg.jpg

    Biometrics, Crime and Security

See More Products
×

Sign-up to receive top management & result-driven techniques in the industry.

Join over 20,000+ industry leaders who receive our premium content.

SIGN UP TODAY!
  • RESOURCES
    • Advertise
    • Contact Us
    • Store
    • Want More
  • SIGN UP TODAY
    • Create Account
    • eMagazine
    • Newsletter
    • Customer Service
    • Manage Preferences
  • SERVICES
    • Marketing Services
    • Reprints
    • Market Research
    • List Rental
    • Survey/Respondent Access
  • STAY CONNECTED
    • LinkedIn
    • Facebook
    • YouTube
    • X (Twitter)
  • PRIVACY
    • PRIVACY POLICY
    • TERMS & CONDITIONS
    • DO NOT SELL MY PERSONAL INFORMATION
    • PRIVACY REQUEST
    • ACCESSIBILITY

Copyright ©2025. All Rights Reserved BNP Media.

Design, CMS, Hosting & Web Development :: ePublishing